Committed to minimizing waste and promoting resource circularity

WT is committed to waste reduction at the source and promoting circular reuse. Waste generated during operations primarily includes office-related waste, domestic waste from employees, and sample IC waste. In logistics centers, additional waste is produced from outer cartons, cardboard, filler materials, and sealing tape. All waste is managed through carefully selected and certified waste treatment providers to ensure compliant and responsible disposal.

Waste Reduction Implementation Strategy

Source Reduction
Continuously promote waste classification and reduction at the source, evaluate the minimization of waste generation, and ensure the implementation of execution plans.
Circular Economy
Collaborate with various district management committees to strengthen waste recycling management and enhance the recycling and reuse of waste resources.
Establish Waste Management Regulations
Implement standardized waste management through waste management regulations, improve environmental sanitation, and prevent secondary pollution.

We are also actively involved in sustainability efforts. In the future, we plan to optimize and transform various company meetings to be more environmentally friendly and align with our sustainability goals. This includes adopting plastic-free and single-use-item-free meeting setups, adhering to the principle of not using disposable tableware or plastic bags. For venue decorations, we’ll use reusable artificial floral arrangements, and replace bottled water with glass cups on tables. To help colleagues develop habits of plastic and waste reduction in their daily lives, we’ve set up eco-bag collection bins in the Zhonghe office. This initiative facilitates the recycling and provision of clean plastic bags, paper bags, and reusable shopping bags, offering more diverse recycling channels for employees to utilize, and gradually working towards the ultimate goal of zero plastic use.

As part of our daily office management practices, we continuously reduce the procurement of single-use consumer products, prioritize the use of durable and reusable items, and strengthen internal communication to promote waste and carbon reduction awareness among employees. We also enforce strict waste sorting and resource recycling measures to achieve our annual target of reducing total waste volume by 1%.

As of the end of 2024, no hazardous waste was generated. All non-hazardous waste was either recycled through regenerative processes or disposed of via incineration. 100% of waste was diverted from landfill.

In 2024, the total amount of waste was 125.07 metric tons, representing a 0.3% reduction compared to 2023. This result reflects our ongoing efforts in environmental stewardship, with the year-over-year decrease primarily attributable to the effective promotion of waste reduction initiatives and enhanced waste sorting management, which have improved overall resource utilization efficiency.

Recycled waste increased by 15.31 metric tons in 2024 compared to the previous year. Specifically, in terms of IC waste, a centralized collection and management approach was promoted to employees at the Zhonghe headquarters starting in 2023. This type of waste is processed by certified recycling vendors. In 2023, 0.09 metric tons of IC waste were recovered, rising to 0.87 metric tons in 2024. 100% of this waste was sent to qualified vendors for circular regeneration. WT will continue to promote IC waste recycling practices in the years ahead to support ongoing waste reduction objectives.


WT Taiwan operational sites and Hong Kong, Singapore logistics centers – 2024 Waste Statistics

Year Non-Hazardous Waste (metric tons) Hazardous Waste (metric tons)
General Waste Recycled (excluding IC waste) Recycled (IC waste)
2023 125.4 6.98 0.09
2024 125.07 21.51 0.87

Notes:1. Waste volumes in some regions are estimated based on per-unit area waste generation at WT’s main operational sites in Taiwan.2. tatistics for recycled waste are compiled from WT’s Zhonghe site in Taiwan. Recyclable non-hazardous waste categories include: pulped paper, iron and aluminum cans, plastic bottles, scrapped hard drives, office equipment, and cardboard boxes. Weight-based statistics are reported by certified waste vendors, who also ensure proper and compliant waste processing.


WT continues to expand waste tracking efforts to its overseas sites. In 2024, a waste composition analysis at our Canada office revealed that paper accounted for 61.35% of total waste, followed by corrugated cardboard at 7.46%. In response, the company has implemented paperless initiatives and a corrugated cardboard recycling program to reduce resource consumption. We will continue monitoring original waste generation volumes to assess the effectiveness of our reduction strategies.

Ongoing promotion of water conservation with employees

At WT, water is primarily used across all operational sites for air conditioning circulation in office and warehouse areas, as well as for employee domestic needs. All water is supplied by local municipal utilities and sourced from freshwater systems. These operations do not pose a significant impact on local water resources or surrounding ecosystems.

To ensure the safety and quality of drinking water for employees, water dispensers are fitted with filters that are replaced monthly to effectively remove harmful substances. In addition, water quality is tested annually by SGS Taiwan to ensure it meets health and safety standards. Aside from evaporative losses from air conditioning system, where data is not practically measurable, other wastewater generated from daily employee use is discharged into municipal sewer systems through the building’s wastewater pipelines.

WT evaluates water-related risks using the World Resources Institute’s (WRI) Water Risk Atlas and has set a target to reduce water usage by 1% annually. According to the 2024 assessment, all disclosed operational sites were located in regions not classified as high or extremely high water stress areas. In 2024, the total disclosed water consumption was 23.62 ML (1,000 m³), covering operations in Taiwan, Hong Kong, South Korea, and China.

Water Resources Inventory Overview (Unit: ML)


Water Consumption
 
Water Discharge
17.01
17.01
2020
11.14
11.14
2021
12.95
12.95
2022
21.32
21.32
2023
23.62
23.62
2024

Note 1: The 2024 reporting boundary includes operational sites in Taiwan, Hong Kong, China, and South Korea. At certain office locations, water charges are embedded within property management fees and are not billed separately, rendering actual water usage estimations infeasible. As these locations account for an immaterial share of overall water consumption, they have been excluded from the disclosed figures.

Note 2: To enhance water resource management, WT has adopted the use of water meter readings from utility bills for statistical purposes starting in 2021. For years prior to 2020, water consumption was estimated based on water bills and unit pricing.

Note 3: Water usage includes evaporative losses from air conditioning systems and employee drinking water, which are considered immaterial and cannot be reasonably measured. All effluent is classified as domestic sewage and discharged directly into municipal sewer systems via the buildings’ infrastructure. As no flow meters are installed to capture actual discharge volumes, water discharge is assumed to equal water consumption for reporting purposes.

Water-saving Improvement Measures for Taiwan Headquarters’ Affiliated Park

Continuously replace water-saving devices/fixtures

Conduct inspections of water faucets and water usage patrols, and implement improvement plans for abnormal situations.

Strengthen promotion and dissemination of information related to water conservation to prevent inadvertent waste.

The water consumption of WT’s Zhonghe headquarters in Taiwan, as externally verified, was 12.28 ML in 2024, representing a 6.4% increase compared to 11.50 ML in 2023. The increase was primarily due to the annual cleaning of the cooling tower and additional water discharge required for tenant fire safety system inspections in 2024. WT will continue to coordinate with the building management committee to implement relevant water-saving improvement measures.

Water Use Verification

Water consumption data for the verified Zhonghe office in Taiwan over the past two years is as follows:

Year Total Water Consumption (ML) Water Intensity (ML/m²)
2023 11.4990 0.0006775
2024 12.2810 0.0007235

Note: The inventory scope for both 2023 and 2024 covers the Zhonghe headquarters office in Taiwan. Verification for 2025 has been commissioned to the British Standards Institution Taiwan (BSI Taiwan).


Expanding renewable energy adoption and procurement initiatives

In alignment with the Ministry of Economic Affairs’ goal of achieving 20% self-generated renewable energy by 2025 and the Paris Agreement’s target of limiting global warming, WT Taiwan began transitioning conventional (grey) electricity with green electricity in 2024. Over the course of the year, the Taiwan operations procured 155,189 kWh of green electricity (including 152 Renewable Energy Certificates), resulting in renewable energy consumption of 558.68 GJ, accounting for 6.46% of total electricity use in the Taiwan region.

Additionally, a 100 kW rooftop solar system was installed at the Shanghai office and began operation in 2024. The electricity generated is primarily used for on-site consumption, totaling 104,613 kWh during the year. This translates to 376.61 GJ of renewable energy, covering 6.38% of the total electricity consumption in the China region.

In total, the Group’s renewable energy consumption in 2024 reached 935.29 GJ, representing 1.38% of the Group’s total energy consumption. To further encourage a transition away from fossil fuel vehicles, the Taiwan office introduced monthly electricity subsidies for employee-owned electric vehicles in 2024, effectively reducing GHG emissions.

Moving forward, WT will continue assessing the feasibility of solar generation, green power procurement, and renewable energy certificate purchases to progressively increase the share of renewables in its energy mix, supporting the goal of achieving net-zero emissions by 2050.

WT’s energy management efforts are centered on digitalized data monitoring and comprehensive equipment management to ensure optimal energy use efficiency. Through ongoing analysis of energy consumption patterns and load characteristics, the company conducts regular maintenance, upgrades, and replacements of existing infrastructure to reduce energy usage.

In 2024, WT’s primary energy source remained non-renewable electricity purchased from local utilities. Other forms of energy consumed include gasoline and diesel for internal operations.

Due to a significant increase in overseas operational sites following the integration of Future Electronics, the Group’s total energy consumption reached 67,641.91 GJ in 2024, an increase of 48,226.38 GJ compared to 2023. Notably, the newly added Future Electronics sites accounted for 48,679.14 GJ, approximately 72% of the total increase. This represents a year-on-year increase of 248.39%.

Annual energy and fuel usage trends

item   2020 2021 2022 2023 2024
Energy Non-renewable electricity (purchased) (kWh) 1,994,138.37 2,068,826.00 4,306,101.71 5,119,255.04 18,685,890.29
Renewable electricity (self-generated/consumed) (kWh) 104,613.00
Renewable energy certificates (purchased) (kWh) 10,000.00 155,189.00
Fuel Gasoline (L) 38,444.59 22,063.51 18,788.63 27,060.01 24,165.88
Diesel (L) 1,735.89 4,494.37 3,944.00 4,048.32

Annual energy consumption of the Group (Unit: GJ)

Item 2020 2021 2022 2023 2024
Fuel Consumption 1,316.28 720.39 771.50 1,022.21 931.38
Electricity Consumption 7,178.90 7,447.77 15,501.97 18,393.32 66,710.52
Renewable Energy Consumption 36.00 935.29
Renewable Energy Usage Ratio 0.19% 1.38%
Total 8,495.18 8,168.16 16,273.46 19,415.53 67,641.91

WT remains committed to continuously lowering its energy consumption and increasing the proportion of renewable energy used.With an annual electricity reduction target of 2%, we strives to enhance energy efficiency and uphold its social responsibility in promoting green energy and environmental protection.


Annual energy consumption of the Group


Total Energy Consumption (Unit: GJ)
 
8,495.18
 
8,168.16
 
16,273.46
 
19,415.53
 
67,641.91
2020
2021
2022
2023
2024
Energy Consumption Intensity (Unit: GJ/operating site area・ square meters)
 
 
0.3611
 
0.3055
 
0.2777
 
0.2157
 
0.0871
2020
2021
2022
2023
2024
Energy Consumption Intensity   (Unit: GJ/NT$ million Revenue)
 
 
0.0241
 
0.0182
 
0.0285
 
0.0327
 
0.0705
2020
2021
2022
2023
2024

Note 1: Please refer to section “5-5 Greenhouse Gas Inventory and Verification Status” for organizational boundaries.
Note 2: Electricity data are sourced from utility bills of each operational site. Gasoline and diesel data are sourced from CPC Corporation’s EBCS financial operations platform or purchase receipts.
Note 3: Electricity conversion factor: 1 kWh of purchased electricity = 0.0036 GJ.
Note 4: Energy conversion coefficients for various fuels are based on the Energy Products Calorific Value Table from the Energy Statistics Annual Report by the Ministry of Economic Affairs’ Energy Administration:
1 liter of gasoline = 7,800 kcal / 1 liter of diesel = 8,400 kcal
Note 5: 1 kcal = 4,186 joules.
Note 6: The denominator for calculating energy intensity is floor area. Please refer to Note 6 of the Greenhouse Gas Emissions Intensity section.
Note 7: The coverage rate of data is calculated using the total floor area of the Group’s operational sites as the denominator and the floor area of the inventoried sites as the numerator.

Greenhouse Gases

WT and its consolidated subsidiaries achieve 100% GHG inventory,surpassing regulatory requirements

Since 2018, WT has proactively conducted GHG inventories in alignment with ISO 14064-1:2018 and the GHG Protocol. To ensure data accuracy and reliability, third-party verification is performed annually.In response to the Group’s rapid operational expansion, WT completed a full GHG inventory across 100% of its operating locations in 2024—one year ahead of the regulatory deadline in 2025.Based on the identification of material indirect emissions, the inventory scope has expanded to include:

• Indirect emissions from imported energy (purchased electricity, Scope 2)
• Fuel- and energy-related activities not included in Scope 1 or Scope 2 (Scope 3)
• Business travel (Scope 3)
• Employee commuting (Scope 3)
• Upstream and downstream transportation and distribution (Scope 3)
• Capital goods (Scope 3)
• Waste generated in operations (Scope 3)

Additionally, emissions from WT’s standalone entity and Taiwan subsidiaries within the consolidated financial statements have been third-party verified by BSI Taiwan.


GHG emission reductions target was met again in 2024

To align with the national greenhouse gas reduction strategy and the long-term targets outlined in the Climate Change Response Act,WT initially designated 2018 as the base year for its GHG inventory. However, due to significant changes in operational boundaries exceeding the materiality threshold (defined as a 3% variance of total emissions), the base year was updated to 2022. Beginning in 2024, WT aims to reduce Scope 1 and Scope 2 GHG emissions by 3% to 5% annually compared to the previous year. Emission reduction initiatives will be implemented in accordance with this target to support the Group’s overall decarbonization goals.

WT Group’s 2022 (base year) GHG Emissions by Category

Scope Scope 1 Scope 2 Total Emissions
Emissions Type Stationary Combustion Mobile Combustion Process Fugitive Energy Indirect
Emissions (t-CO2e/year) 56.2807 47.1418 1,494.3245 1,597.7470
Percentage % 3.52 2.95 93.53 100
Emissions (t-CO2e/year) 103.4225 1,494.3245 1,597.7470
Percentage % 6.47 93.53 100


For 2024, the scope of WT’s externally verified operations included operational sites and warehouses in Taiwan, as well as logistics centers in Hong Kong and Singapore. Scope 1 GHG emissions totaled 101.7286 tonnes CO2e, while Scope 2 (market-based) emissions amounted to 1,388.7021 tonnes CO2e, bringing the combined Scope 1 and 2 (market-based) emissions to 1,490.4307 tonnes CO2e.
No carbon offsets were applied in 2024. However, through emission reduction measures, such as the procurement of 155,189 kWh of green electricity in Taiwan. WT achieved a 3.35% reduction in GHG emissions compared to 2023, successfully meeting our Scope 1 and Scope 2 reduction targets within the verified regions.

WT Group 2024 scope 1 emissions by gas type

Greenhouse Gases (GHG) CO2 CH4 N2O HFCs PFCs SF6 NF3 Emissions
Emissions (t-CO2e/year) 62.6084 9.0835 1.8264 28.2103 101.7286
Percentage (%) 61.54 8.93 1.80 27.73 100

In addition, WT conducted a comprehensive voluntary GHG inventory for all operational sites group-wide in 2024. The inventory scope was structured into three major regions: Asia-Pacific (APAC), Americas, and Europe, Middle East, and Africa (EMEA), with emissions disclosed using a location-based approach by site.
In 2024, WT conducted a voluntary GHG inventory across all its global operational sites. The results showed Scope 1 emissions of 2,127.48 tonnes CO2e and Scope 2 emissions (location-based approach) of 5,318.54 tonnes CO2e, bringing the total Scope 1 and 2 emissions to 7,446.02 tonnes CO2e. The regional breakdown of these emissions is illustrated in the figure below. WT will continue to monitor emissions across all locations in the years ahead and gradually expand the scope of external verification.

WT 2024 self-inventories of regional emissions (Unit:tonnes CO₂e)

2024 GHG Emissions APAC Americas EMEA Total
Scope1 468.75 306.34 1352.39 2127.48
Scope2 3214.72 1316.89 786.93 5318.54

Although We implemented several emission reduction initiatives in 2024, including the replacement of 660 fluorescent lamps with LED lights at the Taiwan headquarters (resulting in an estimated electricity saving of 43,212 kWh), and the activation of a solar power generation system at the Shanghai site (producing 104,613 kWh of self-used electricity), total GHG emissions still increased compared to 2023.
The rise in emissions was mainly due to the expanded scope of the 2024 voluntary inventory, which newly incorporated all operational sites of Future Electronics and additional Scope 3 emission sources, including employee commuting, capital goods, upstream and downstream transportation and distribution, and waste generated during operations.
Moving forward, we will continue to implement carbon reduction measures across its global operational sites, aiming to reduce the environmental impact of its carbon footprint and steadily advance toward our low-carbon targets.


Greenhouse Gas Emissions by Category(Unit:tonnes CO2e)

Scope 1
219.66
 
2020
144.70
 
2021
218.82
 
2022
315.60
 
2023
2127.48
 
2024
Scope 2
1015.02
 
2020
1038.55
 
2021
2362.90
 
2022
2463.10
 
2023
5318.54
 
2024
Scope 3


190.95
 
2021
212.33
 
2022
134.51
 
2023
20487.71
 
2024
 
Scope 1+2
1215.42
 
2020
1183.25
 
2021
2581.71
 
2022
2778.70
 
2023
7446.02
 
2024
Scope 1+2+3
1215.42
 
2020
1374.20
 
2021
2794.04
 
2022
2913.21
 
2023
27933.73
 
2024

GHG emissions intensity (Unit:tonnes CO₂e/ operating site area・square meters)

Scope 1
0.0093
 
2020
0.0054
 
2021
0.0031
 
2022
0.0035
 
2023
0.0027
 
2024
Scope 2
0.0431
 
2020
0.0388
 
2021
0.0331
 
2022
0.0274
 
2023
0.0068
 
2024
Scope 3


0.0071
 
2021
0.003
 
2022
0.0015
 
2023
0.0264
 
2024
 
Scope 1+2
0.0517
 
2020
0.0443
 
2021
0.0361
 
2022
0.0309
 
2023
0.0096
 
2024
Scope 1+2+3
0.0517
 
2020
0.0514
 
2021
0.0391
 
2022
0.0324
 
2023
0.036
 
2024

GHG emissions intensity (Unit: tonnes CO2e / NT$ million revenue)

Scope 1
0.0006
 
2020
0.0003
 
2021
0.0004
 
2022
0.0005
 
2023
0.0022
 
2024
Scope 2
0.0029
 
2020
0.0023
 
2021
0.0041
 
2022
0.0041
 
2023
0.0055
 
2024
Scope 3


0.0004
 
2021
0.0004
 
2022
0.0002
 
2023
0.0214
 
2024
 
Scope 1+2
0.0034
 
2020
0.0026
 
2021
0.0045
 
2022
0.0047
 
2023
0.0078
 
2024
Scope 1+2+3
0.0034
 
2020
0.0031
 
2021
0.0049
 
2022
0.0049
 
2023
0.0291
 
2024

Note 1: Please refer to section “5-5 Greenhouse Gas Inventory and Verification Status” for organizational boundaries.
Note 2: The 2024 voluntary greenhouse gas inventory covered 100% of WT Group’s operational sites.
Note 3: The 2024 GHG inventory verification scope includes all operational sites of WT’s individual company and its Taiwan subsidiaries included in the consolidated financial statements. Location-based GHG emissions from externally verified operational sites: 1,566.8972 tonnes CO2e Market-based GHG emissions from externally verified operational sites: 1,490.4307 tonnes CO2e
Note 4: Electricity emission factors for verified regions in 2024 were based on data from local regulatory authorities: Taiwan: 0.494 tonnes CO₂e/thousand kWh (MOEA Energy Administration) Hong Kong: 0.3900 tonnes CO₂e/thousand kWh (CLP Hong Kong) Singapore: 0.4168 tonnes CO₂e/thousand kWh (EMA) Publicly available national electricity emission factors were used for other voluntarily inventoried regions.
Note 5: Fuel and refrigerant emission factors are based on the Ministry of Environment’s compiled research on greenhouse gas emissions — Emission Factor Management Table, Version 6.0.4.
Note 6: Global Warming Potential (GWP) values are based on the IPCC Sixth Assessment Report (2021).
Note 7: Historical Floor Area of Inventory Scope (m²). 2020: 23,528 m² 2021: 26,740 m² 2022:
- 40,178 m² (externally verified sites)
- 71,460 m² (externally verified + self-inventoried sites) 2023:
- 45,117 m² (externally verified sites)
- 99,537 m² (externally verified + self-inventoried sites) 2024:
- 45,693 m² (externally verified sites)
- 776,439.74 m² (externally verified + self-inventoried sites)


2024 Energy Efficiency Initiatives and Achievements

Green Energy Programs

The solar power system at the Shanghai office was connected to the grid in Q1 2024 and generated 104,613 kWh for self-use throughout the year.

The Taiwan headquarters purchased 155,189 kWh of green electricity (including 152 Renewable Energy Certificates), resulting in a total reduction of approximately 76.81 tonnes CO2e. The company will continue purchasing green power/RECs.

Automated warehousing system was implemented at the Singapore facility.

Internal carbon pricing mechanism is under development, with ongoing evaluation of its effectiveness.

Energy Consumption Reduction

Equipment was installed with timer controllers to automatically activate energy-saving modes.

Lighting is adjusted with alternating patterns or reduced bulb counts, ensuring eye comfort and zoned control.

Air conditioning is set to 26-28°C and used with fans when appropriate; zoned power management is applied.

Non-essential lighting is turned off automatically during lunch breaks.

Lighting in warehouse areas is minimized by adopting unmanned operations where applicable.

Efficiency Improvements

Equipment is regularly maintained and replaced when outdated.

The Taiwan headquarters replaced 660 fluorescent lights with LEDs, resulting in an estimated reduction of 43,212 kWh in electricity consumption.

Energy-Efficient Equipment

Priority is given to purchasing high-efficiency, energy-saving, and eco-labeled equipment.

Installation of blackout curtains.

White or light-colored wall and ceiling materials are used to enhance light reflection.

Infrared motion sensor switches are used in infrequently accessed public areas.

Employee Engagement

Monthly EV charging subsidies are provided for employees using electric vehicles in Taiwan to encourage a shift from traditional vehicles.

Waste is properly sorted, and standby power waste is minimized.

Employees are encouraged to commute, travel for business, and participate in company outings via public transit or ride-sharing.


The event was awarded a carbon reduction label at the end of April 2025
WT Group collaborated with the Chinese Taipei Ultra Marathon Association to promote the initiative of “Implementing Green Sporting Events.” The campaign advocates the adoption of 6R principles – Reduce, Reuse, Recycle, Refuse, Replace, and Remind, to drive energy conservation and carbon reduction practices. The event also applied for a Carbon Reduction Label as a model for organizing sustainable and environmentally friendly sports events.

On September 7, 2024, the Cilan Forest Trail Race in Yilan County welcomed nearly 600 participants, including 50 international runners from 14 countries, such as Australia, Hong Kong, Japan, South Korea, and Mongolia. The race featured multiple categories: Ultramarathon distances of 100km, 80km, and 50km, as well as shorter distances of 25km, 10km, and 5km, attracting elite trail runners from across the region.
The Cilan Trail Race first conducted a carbon footprint inventory in 2022 and received both third-party international verification and the first official Carbon Label for a sporting event issued by Taiwan’s Ministry of Environment. In 2024, the race underwent a second carbon footprint assessment to evaluate the impact of revised race logistics and structure, positioning it as a pioneer in actionable green sports events.
The Chinese Taipei Ultra Marathon Association has also played a key role in promoting the “Sports Sustainability Label” issued by the Asia Oceania Ultra Athletics (AOUA). Within a short time, the label has been successfully implemented in both domestic and international events, demonstrating substantial impact. In 2025, the association will continue to promote this systematic, objective, and credible labeling system to the global running community, encouraging more races to join the movement toward sustainable sports.


Response to Climate Change

Climate change is an issue that needs the world to face together, no matter who. As an electronics component distributor, WT has operating sites, partners, collaborators, and vendors all over the world and they are all subject to impacts of climate change. WT’s management understands the potential impact of climate change on its operations and long-term development. Since 2021, it has been promoting relevant management mechanisms and operations, formulating policies and goals, and investing resources in assessment and research on transition plans. In the future, it will continue to track the achievement of goals, and take a more aggressive course of action accordingly.

Climate change governance and architecture

Board of Directors The highest decision-making unit for climate change risk management is responsible for approving relevant risk management measures, tracking the implementation of climate-related risk management, guiding decision-making response plans, and supervising the implementation results and goal achievement of the plans.
Sustainable Development Committee A functional committee established by directors and independent directors regularly reports to the Board of Directors the results of climate change risk and opportunity assessments and guides the implementation of climate risk and opportunity management.
Risk Management Team It is composed of the Accounting Officer and other senior executives of the sustainability management team to coordinate and plan risk management processes such as identification of risks and opportunities, and planning of response plans. Regularly confirm implementation results and integrate climate change risk management reports.
Functional/Business units Regularly conduct assessment and analysis of climate change risks and opportunities, plan and implement response plans, and regularly report implementation results and performance.

Risk management team held four meetings in 2024, inviting each functional/business unit to identify risks and opportunities, assess financial impacts, and discuss response plans. The evaluation and planning results will be incorporated into the operation promotion plan of relevant units and reported to the Board of Directors periodically as reference for governance


Climate change risk and opportunity management process

Climate-related risk assessment has been integrated into the existing risk management mechanism and regularly conducted by the Risk Management Team. WT will continue to follow the climate change risk management process to identify risks and opportunities, evaluate response strategies, and conduct regular internal and external reports.

Climate change risk assessment process

01

Risk item inventory

• Identify possible risks and opportunity projects with reference to TCFD recommendations, relevant domestic and foreign regulations, and expectations of external stakeholders.

02

Key risk analysis

• Analyze and identify key risks based on the risk occurrence time interval, risk occurrence possibility, risk possible location, and degree of risk impact.
• Sort the analysis results in a quantitative manner and select the top three risk and opportunity items as key risks.

03

Financial impact assessment of risks and opportunities

Consider the possibility of risks/opportunities occurring and the extent to which they affect operations, and evaluate the possible financial impact items and extent.

04

Response planning and reporting

For key risks and opportunities, the degree of financial impact is considered, response strategies are evaluated (mitigation, control, transfer, and tolerance), and response plans are planned.
• Reporting is performed in accordance with internal management procedures. Implementation results are regularly disclosed in the sustainability report.


Scenario analysis

As WT does not operate in a sector with intensive or high carbon emissions, the impact of climate change is mainly on its value chain, including the transition pressure on the vendors and customers, and potential physical risks during the transport. In order to understand the impact of these transitional and physical risks on WT’s operations, WT uses scenario analysis to identify risks and opportunities. The assessment results are used for response plan development by relevant units, and for daily operation adjustment. These are also reported on an annual basis to the Sustainable Development Committee and the Board.

Therefore, WT conducts the annual climate change risk assessment based on the SSP5-8.5 scenario from IPCC AR6 Shared Socioeconomic Pathway (SSP) for physical risk, the national target scenario for transitional risk, as well as information such as changes in laws and regulations, physical external environment, and issues of concern for sustainability assessments.


Climate change risks and opportunities

The acquisition of Future Electronics in 2024 has globally expanded our operational scope. WT reviewed the risks and opportunities identified and ranked in 2021 and selected items that may have an impact in the short term (1 to 3 years) based on the implementation benefits. After understanding current implementation status, WT re-evaluated the impact scale and financial impact, and identified three key risks that require continued attention and two major opportunities.

Three major climate change risk factors

Risk Factors Impact Scope Financial Impacts Response Strategies and Solutions
Increased severity and frequency of extreme weather events (typhoons, storms, etc.) Directly on the operations ∙ Decreased asset value
∙ Reduced asset service life
Note: Based on WT’s internal assumptions and calculation factors, the maximum financial impact may be NT$50 million approximately.
Short-term: Understand meteorological information in real time, plan prevention and response measures accordingly for different natural disasters, and continue to maintain full communication with the park management center.
Mid-term: It mainly focuses on transferring and diversifying risks, and purchasing relevant property insurance. The location of important configurations is continuously evaluated and needs to be located in an area less affected by the climate.
Long-term: When choosing to add/relocate an operating location, the assessment items include climate change factors (such as flood prevention, earthquake prevention, etc.).
Extreme climate and high temperatures Directly on the operations ∙ Increased operating costs
Note: Based on WT’s internal assumptions and calculation factors, it may cause a financial impact of NT$14.5 million approximately per year in the future.
Short-term: When purchasing, priority is given to products with energy-saving labels, including office environments, electrical equipment, office machines, etc. Energy-saving facilities are installed, and the energy-saving results of each unit are regularly reviewed. Continue to promote energy conservation and various activities, and integrate the concepts into the habits of all colleagues, with the aim of reducing energy dependence.
Mid-term: Continuously review whether the replacement plan is in line with the latest trends to ensure that the energy efficiency of the relevant equipment used meets expectations.
Long-term: Establish a stable energy supply strategy, including seeking alternative energy and developing renewable energy.
Extreme weather events impacting supply chain logistics Directly on the operations, vendors, customers ∙ Increased cost of capital
Note: Based on WT’s internal assumptions and calculation factors, it may cause a financial impact of NT$500,000 approximately per day.
Strengthen communication with customers, including exchanging information on the impacts of climate change, to reduce the impact of the effect on supply chain logistics.

Note: Short-term 1 to 3 years, medium-term 3 to 5 years, and long-term over 5 years

 
Two major climate change opportunities factors

Opportunity Factors Financial Impacts Response Strategies and Solutions
Reduced capital acquisition cost ∙ Reduced operating costs Continue to pay attention to the sustainability indicators related to the organization and the performance of the sustainability indicators related to the organization. Actively communicate green financing conditions with financial institutions. By the end of 2024, the Company has reached 5 green financing interest rate agreements.
Develop/expand low-carbon products or services ∙ Increased demand for products leads to increased revenue ∙ Short-term: Plan product application and category analysis work, and define low-carbon products.
∙ Mid-term: Continue to track the technology application capabilities of the vendor and improve the support capabilities for the vendor’s low-carbon products.
∙ Long-term: Actively market low-carbon products to customers and increase the sales proportion of low-carbon products.


Major indicators and goals for climate change

In response to international trends and Taiwan’s 2050 net-zero goal, WT set climate change indicators and goals in three aspects: governance and strategy, operations, and GHG reduction.

Aspect Indicator Short-term Mid-term Long-term
Governance and strategy Linking Executive Compensation to ESG Performance The remuneration of directors and managers is determined and reviewed in accordance with the Procedures for Remuneration of Directors and Functional Committee Members and the Procedures for Remuneration for Managers as necessary to strike a balance between sustainable management and risk control. In 2024, we established an Executive Compensation and Clawback Policy, incorporating environmental and social performance metrics, each accounting for 10% of the evaluation criteria.
Internal carbon pricing Implementation plans are made to evaluate and roll out internal carbon prices.
Implementation of climate change risk management Risks and opportunities are assessed, analyzed and reported every year.
Operation Asset insurance rate 20% 40% 100%
Proportion of energy-saving lights and green-labeled energy-saving electrical appliances 50% Lights in Taipei HQ are 100% LED.
Electrical appliances are 80% green energy-saving.
Electrical appliances are 100% green energy-saving.
Customer demand forecast ∙ Order volume for the next three months are updated monthly.
∙ Delivery schedules are updated monthly.
∙ Contracts are amended to incorporate climate exclusion clause.
   
Reduced capital cost ∙ ESG credit line proportion is increased year by year, achieving 10% in stage one.
∙ Mid-term financing is linked to ESG indicators.
Financial institutions are engaged to formulate ESG indicators suitable for the distribution sector, and further expand the ESG credit line. Relevant ESG indicators are included in WT’s sustainable target management.
Proportion of revenue involved in sustainable economic activities ∙ All suppliers provide statement of compliance with the latest regulations on the restriction of hazardous substances.
∙ Green energy, energy storage, and low-carbon transportation related applications are studied and designed.
∙ Suppliers are continuously required to comply with the latest environmental laws and regulations.
∙ System solutions are offered for green energy, energy storage, and low-carbon transportation related applications.
Revenue portion involved in sustainable economic activities is 20% or more.
GHG emissions GHG inventory Inventory of all operating sites are developed by 2025. Inventory of all operating sites are verified by 2027.  
Total emissions Down by 3%-5% every year compared with previous year Scope 1 and 2 emissions down by 50% relative to 2022 by 2035 Net zero carbon emission by 2050

Environmental Management

Environment-oriented improvement timeline

2024

∙ Shanghai office rooftop solar power generation system activated.

∙ First green electricity purchase in Taiwan.

∙ Provided monthly electric vehicle charging subsidies to employees in Taiwan.

∙ Committed to net-zero by 2050.

∙ Initiated the implementation of AutoStore automated warehousing across various warehouses.

2023

 100% GHG inventory coverage First purchase of renewable energy certificates

2022

∙ Expanded coverage of greenhouse gas inventory to more operational sites

2021

∙ Awarded Excellent Enterprise of Green Consumption and Environmental Protection Volunteer by New Taipei City

2018

Began to conduct organizational GHG inventory and have it verified by a third party

2015

  
∙ Taiwan and Hong Kong Logistics Centers were certified ISO 14001: Environmental Management Systems (EMS)

2012

  ∙ Began to replace T5 lights with LED ones

Elevating our carbon reduction standards in response to the worldwide trend of energy conservation and emission reduction.

WT has been conducting a voluntary GHG inventory since 2018. In 2024, the group completed a comprehensive GHG inventory covering all operational sites of its subsidiaries under the consolidated financial statements, achieving 100% inventory coverage. Third-party verification was also conducted for all operating locations of WT’s individual company and its Taiwan subsidiaries included in the consolidated statements, with a 6% verification coverage. We aims to achieve 100% external verification by 2027 at the latest.

Localization of general affairs procurement: 99.4% local sourcing achieved in 2024

Considering customer needs and its role as an agent for globally renowned IC technology manufacturers (referred to as original suppliers), WT’s local procurement management primarily focuses on general affairs procurement items not related to agency products. In 2024, WT’s Taiwan headquarters achieved a 99.4% local sourcing rate from domestic suppliers. This statistic covers procurement expenses across administrative and general affairs, IT equipment, and logistics center purchases.

Proportion of local procurement, 2020-2024

 
2020
Proportion of local procurement: 99.8%
Proportion of non-local procurement: 0.2%
 
2021
Proportion of local procurement: 96.8%
Proportion of non-local procurement: 3.2%
 
2022
Proportion of local procurement: 98.3%
Proportion of non-local procurement: 1.7%
 
2023
Proportion of local procurement: 100%
Proportion of non-local procurement: 0%
 
2024
Proportion of local procurement: 99.4%
Proportion of non-local procurement: 0.6%
 

Proportion of local procurement


Proportion of non-local procurement


Note:The 2024 data accounts only for general affairs procurement at WT’s Taiwan headquarters. The local suppliers in Taiwan refers to companies legally registered in Taiwan. As WT has not yet established a data collection mechanism for overseas sites, efforts are currently underway to develop an information integration and consolidation system. We plans to disclose local procurement data for other operational locations as the system is implemented.

Prioritizing green procurement: NT$24.76 million in 2024

In our general affairs procurement, WT adheres to a policy of giving priority to green-labeled products. We have participated in the New Taipei City Environmental Protection Department’s initiative to promote green procurement among private enterprises, and have received the Green Consumption Outstanding Enterprise award for five consecutive years.

In 2024, the total amount declared for green procurement in Taiwan reached NT$14.28 million. In China and other overseas regions, we procured eco-labeled laptops and servers totaling NT$10.48 million. Moving forward, WT will continue to prioritize the selection of recyclable, low-pollution, and resource-efficient green products, reinforcing our commitment to sustainable consumption.

Environmental management spending has been increased over the years

WT has been voluntarily developing GHG inventory for many years. In addition to third party verification, the inventory has been extended to include more operating sites over the years for a more comprehensive scope and a more reliable dataset. Additional environmental management training sessions are also conducted to enhance everyone’s sustainability awareness. In 2024, the Taiwan headquarters spent NT$4.02 million on related management systems, training and activities. See below for courses held in 2024.

Course title Duration (in hours) Attendance (in persons)
【Major Policies】 Awareness Training on ESG– Awareness Training on ESG  1 1103
A Global Trend on AI Governance 3 75
“Policy Interpretation on Sustainability Information Disclosure” and Key Topics in Internal Control and Internal Audit Seminar 6 1
“A Low-Carbon Future: Energy Efficiency and Emerging Energy Industry – Review and Outlook” Online Seminar 6 1
Responsible Business Alliance (RBA) Code of Conduct 7.0 0.5 9
 
ESG】What is a SASB Standard?  e-Learning Programs 4
ESGCan the world rely on carbon pricing to cut carbon emissions? Analyzing the past and present of carbon tax and carbon trading 1
ESG What you must know about the EU Carbon Border Adjustment Mechanism (CBAM) 2
ESG Do companies implement TCFD? 2
ESG Introduction to TCFD and climate-related financial disclosure practices in Taiwan 2
ESG ESG Initiative: Guided reading event for “The Carbon Almanac: It’s Not Too Late” 1

Environmental Spending (in NTD 10,000)

257
2020
153
2021
323
2022
271
2023
402
2024

Beach cleanup task force: Advancing marine conservation

WT remains committed to environmental initiatives within our communities, including urban greening, ecological preservation, resource recycling, and the circular use of second-hand goods. In 2024, we adopted several beaches along Shimen Baishawan, Laomei Green Reef, Kite Park Beach, and Zhongjiao Sa-Chung Wan of the North Coast of New Taipei City, organizing monthly cleanup events and encouraging employee participation.

These cleanups served not only as environmental actions but also as educational opportunities, fostering engagement and raising awareness about waste management. Through active involvement, employees were reminded of the importance of proper waste sorting and refraining from littering in both workplace and domestic settings.

A particularly impactful experience occurred following a typhoon, when beaches were strewn with driftwood, styrofoam, large-scale marine debris, and the remains of marine life entangled in waste. These scenes powerfully illustrated the widespread harm of pollution, not only to human environments but also to the ecosystems on which other species depend.

The primary purpose of our beach cleanup initiative extends beyond the physical act of collecting trash. It aims to instill a deeper understanding of resource circularity, the urgency of reducing waste at the source, and the shared responsibility we bear in protecting our environment.

Over the course of the year, 284 participants contributed to the cleanup efforts, collectively removing 1,348.9 kilograms of marine debris.


Green Logistics

As logistics operations is its most important operational activity besides integrated product sales and services, WT implements the low-carbon internal logistics operation strategy through four major logistics operation improvements. In addition, with regard to the transportation carbon reduction emissions strategy, it has also begun to evaluate the feasibility of green transportation.Starting from 2024, we will integrate and analyze data from Future Electronics’ logistics centers across Asia, Americas, and Europe.

Energy-efficient and carbon-lean hardware

Shortest
transportation route

Digitized warehouse management

Packaging recycling

Green Logistics


Hong Kong Logistics Center Electricity Saving Percentage (Base Year: 2021)
100%
 
2021
80%
 
2022
68%
 
2023
75%
 
2024

Updating warehouse equipment to improve energy efficiency

As 3C products must be stored in a constant temperature and humidity environment to maintain their quality and performance, a 3C product warehouse must be equipped with appliances such as air conditioners, dehumidifiers, etc. WT continues to introduce and connect intelligent temperature and humidity monitors to AC controllers to reduce energy consumption.

In May 2021, the Hong Kong Logistics Center was relocated and opted for a chiller plant instead of air conditioners in the new facilities. As of 2024, its electricity consumption was reduced by 24.5% relative to 2021. In May 2023, the Singapore Logistics Center adopted the concept of dark warehouse and automated the operations. Lighting is no longer required, as human input is normally not required in the storage area. Its total electricity consumption in 2024 was already 29.58% lower than that of the same period in 2022

Introducing advanced electronic systems for comprehensive paperless inventory management

WT has 11 logistics centers, located in Taiwan, Hong Kong, Shenzhen, Singapore, South Korea, United States and Germany. When a purchase order is placed, the shortest footprint across the supply chain as well as the respective demand and inventory of these locations are taken into account by the system to determine and designate a logistic center for the vendors to ship to.

An advanced logistics system has been deployed to all the logistics centers to achieve paperless electronic operations, while handheld devices are used to scan product and storage placement barcodes for all warehouse handling including receiving, shipment, and relocation. Accounting and location is updated in real-time by the system, replacing the significant amount of paperwork that it used to involve.

Receiving management Warehousing management Shipping management
∙ When a purchase order is placed, the shipment is set to be received by the warehouse that is the closest to the scheduled delivery destination
∙ The shipment and logistics information from the vendo is interfaced to the freight tracking system to keep an up-to-date track on the shipment.
∙ After the vendor ships out the PO is automatically interfaced to the warehouse receiving system (status “pending”) to promote paperless operations.
∙ The receiving procedures are all performed with PDAs scanning barcodes for the material number, quantityand manufacturing-related information.
∙ A logistic system was introduced to process all warehousing management with electronic procedures. Upon slotting, sorting, relocation, product barcodes are scanned with PDAs to update inventory record on the system.
∙ For inventory taking, the system generates an electronic inventory.After the product barcodes are scanned and quantities are entered into PDAs against the list, the system will generate an inventory result report in real time.
∙ Upon acceptance of a shipment order, the system automatically picks the goods according to the first-in-first-out principle.Priority is also given to shipping in the original carton to reduce the use of packaging materials.
∙ For an order is less than the quantity of one original container, the system automatically selects the most suitable carton size for the quantity to reduce the use of filling materials. The original carton is recycled and reused for another shipment order that fits.
Reduced paper consumption for receiving and shipping procedures at logistic centers, 2020-2024

An average of about 1.04 million sheets of A4-size paper saved every year

2024


1,098,541
2023


900,671
2022


1,092,211
2021


923,922
2020


1,055,675
 

Taiwan


Hong Kong


China


Singapore


South Korea

Note: No statistics for Singapore and South Korea until 2022

Largely cutting paper use by shipment consolidation and electronic procedures

In addition to requiring vendors to ship goods to designated logistics centers, WT also works with customers to consolidate purchase orders for shipment whenever possible to minimize transportation trips and carbon mileage. In 2023, the merger with Future Electronics, had approximately 440,000 shipment orders and around 190,000 delivery notes. Through shipment consolidation, the number of delivery trips was reduced by 56.65%. In 2024, including Future Electronic, the total number of shipment orders reached around 2.6 million. After order consolidation the number of shipments reduced by nearly 1.39 million, or 53.32%. Future Electronics’ customer orders are typically small in quantity and diverse in variety, with most deliveries made via express couriers. Starting in 2025, from Singapore, WT and Future Electronics will integrate their logistics providers and delivery methods. This will allow shipments to the same customer to be consolidated, further reducing transportation frequency and lowering emissions.

Reduced shipment trips and proportion due to consolidation in 2024
 
Shipping trips
 
Proportion


57,050
 
203,336
 
11,002
 
20,726
 
3,353
 
1,093,771
 
1,389,238


48.86%
66.26%
27.33%
60.35%
80.27%
52.01%
53.32%
Taiwan
Hong Kong
Shenzhen
Singapore
South Korea
Future Electronics
Total

Buying less new cartons and filling materials by reusing packaging cartons

Through the integrated management of sales orders and purchase orders, some received products can be shipped out in full boxes. They will be put into storage in their original packaging without unpacking. No waste will be generated. If repackaging is necessary, the removed cartons and all the fillers within will be collected upon receiving process. The cartons will be classified as “eco-friendly cartons” for reuse. For shipment packaging, recycled cartons will be used whenever possible to reduce the use of new cartons. The fillers used to protect the products in the cartons are made of bio-degradable materials. The protective fillers used inside cartons are made from eco-friendly, biodegradable materials. The selected filling materials comply with the latest regulations from the Ministry of Environment, utilizing HDPE (High-Density Polyethylene) and excluding PVC (Polyvinyl Chloride). They are certified under the Global Recycled Standard (GRS 4.0) and meet the Environmental Protection Administration’s requirement of containing at least 25% recycled content.

In 2020, Taiwan and Hong Kong began to keep track of the amount of fillers used (in meters). Starting from 2024, with the inclusion of the Future Electronics logistics center, an average of 0.92 meters of filler material has been used per carton. This is mainly due to Future Electronics’ receiving process, where all original cartons are removed upon receipt and products are repacked for outbound shipments, requiring additional filler material to protect the items.

Filling material usage per carton

(in meters/carton)

2024
0.92
2023
0.21
2022
0.19
2021
0.23
2020
0.37

Note: Only the usage at the logistics centers in Taiwan, Hong Kong, and Future Electronics is included in the statistics, as the logistics centers in Singapore and Korea receive full cartons and ship them directly to a single customer without the need for unpacking or repacking.

WT continues to cut down on packaging materials with efforts including using paper pallets whenever possible for loading products in warehouses and shipments, reducing the usage of fillers, and always using renewable packaging materials for logistics operations. Newly purchased cartons also adopt the principle of minimal printing, with only stacking and transportation precautions marked and no additional graphic or text printed. (Based on Carbon Footprint Information Platform, Corrugated cardboard (AB flute) has an emission factor of 1.30E+0 kgCO₂e per kilogram and reduced CO2 emission by 1,543 tonnes). After being integrated into the Future Electronics in 2024, the nature of its orders (small quantities with high variety) combined with the highly automated warehouse systems in the Americas and Europe, led to a shift toward using new cartons for picking and packing based on order quantity. As a result, the use of recycled cartons or direct shipment in original cartons decreased by 29.82% compared to 2023. The Future Electronics Singapore logistics center plans to implement the WT EWM system in the second quarter of 2025, which is expected to optimize the ratio of recycled and original carton shipments.

Proportion of new carton usage, 2020-2024
Increase 29.82% in 2024 due to Future Electronics included
2024
 
57.27%
2023
 
27.45%
2022
 
23.12%
2021
 
24.26%
2020
 
30.17%


Sustainable Supply Chain

To ensure a safe working environment throughout WT’s supply chain, uphold respect and dignity for employees, promote environmental protection in operations, and maintain ethical management practices, we have established a Supplier Code of Conduct.This Code outlines expectations for suppliers in five key areas: labor and human rights, health and safety, environmental protection, ethics, and management systems.Suppliers are required to comply with both this Code and all applicable laws and regulations in the countries and regions where they operate.

Supplier Code of Conduct

A
Labor and Human rights: Vendors shall, in accordance with laws and regulations, commiting to uphold human rights and dignity of laborers, and shall not employ child labor, discriminate, harass, impose corporal punishment, or allow excessive overtime work.
B
Health and safety: Vendors should provide a safe and health management systems. Vendors should also understand that employee feedback, education and training are crucial to identifying and solving health and safety problems in the workplace.
C
Environmental protection: Vendors shall abide by local laws and regulations, mitigate the adverse impact on the environment as a principle, and reduce resource consumption and pollution discharge.
D
Ethics: Vendors shall adhere to the highest ethical standards, including: ethical operation, anticorruption, imformation disclosure, intellectual property, fair trade, privacy, etc.
E
Management: Vendors management shall establish a management system of which the scope is relevant to the content of this Code.


Carefully vetting and partnering with like-minded suppliers

WT aims for long-term partnerships with General Affairs suppliers who share our core values. To this end, our management has established a “General Affairs Supplier Code of Conduct” for these suppliers. All General Affairs suppliers are required to sign the “Supplier Corporate Social Responsibility Commitment Letter” and complete an online “Supplier Self-Assessment Form.” Our procurement team evaluates the results of these self-assessments to identify potential risks in areas such as human rights, labor practices, consumer protection, ethical business conduct, environmental protection, and health and safety. We ensure that 100% of new GA suppliers are screened and selected based on environmental and social standards. In addition, we are committed to strengthening sustainability awareness among our GA suppliers to prevent major deficiencies or legal violations.

In 2024, WT Group has completed the signing of Corporate Social Responsibility Commitment Letters with existing General Affairs suppliers in Taiwan and China, achieving a 100% signing rate. Following the merger of Future Electronics into the group, the overall signing rate for target General Affairs suppliers across the entire group is 33.9%. Going forward, we will continue to integrate global General Affairs suppliers into a unified management system, strengthening our commitment and oversight on environmental, labor, and human rights issues to ensure the supply chain complies with the group’s responsible procurement policy.

In alignment with global environmental protection trends, WT revised the General Affairs Supplier Code of Conduct in 2024. New environmental requirements were added to ensure that suppliers comply with international, national, and local biodiversity regulations when conducting their operations and business activities. These requirements include avoiding deforestation and preventing harm to endangered or protected species, while also supporting forest and land conservation.

To maintain procurement quality, annual assessments are conducted for General Affairs suppliers with annual transaction amounts exceeding NT$1 million or with more than 12 transactions per year. The assessment scope includes supplier performance in delivery quality, delivery timeliness, service capability, ESG implementation, environmental protection, and occupational health and safety.

Assessment results are categorized into four levels: A, B, C, and D, we also track and facilitate improvements for suppliers rated C and D. In 2023, two suppliers received a C rating; one was replaced in 2024, while the other improved to a B rating after guidance and assistance, thus maintaining our partnership.

In 2024, the qualification rate (C-level and above) for suppliers in Taiwan and China reached 100%, with Class A suppliers accounting for 80.0%. Four suppliers received a C rating; while we provide guidance and support for improvement, we are also actively seeking alternative suppliers to enhance supply chain resilience and maintain supply levels and quality standards. We plan to integrate these assessment guidelines into our overseas operational sites in the future.

Due to the expanded scope of operations in 2024, the assessment of General Affairs suppliers this year still focused on WT’s existing suppliers, with an assessment rate of 100%. After the inclusion of Future Electronics, the overall assessment rate for target General Affairs suppliers across the entire group is 33.9%. Going forward, we will gradually expand the scope of assessments as planned and continue to improve the assessment processes and indicators to strengthen the sustainable risk management of the global supply chain.

Supplier Assessment Standards

A
Delivery Quality: Assesses whether the supplier’s goods meet quality and specification standards, and if product packaging is intact.
B
Delivery Timeliness and Service: Able to deliver on time or earlier according to company needs, quality of after-sales service and technical service.
C
ESG Implementation: Verifies whether the supplier has published corporate social responsibility-related reports and if they have made declarations or commitments regarding relevant issues.
D
Environmental Protection: Confirms the supplier’s commitment to environmental protection, including the implementation of environmental and energy-saving management measures, effective promotion of environmental sustainability, and ensuring that their operations, products, and services do not cause significant negative environmental impacts or violate environmental regulations.
E
Occupational Health and Safety: Ensures that the supplier’s employees and working environment comply with labor standards laws and related labor regulations.

Supplier Evaluation Overview

Number of suppliers evaluated
128
 
2023
115
 
2024

Average supplier evaluation score
84.07
 
2023
84.8
 
2024

Percentage of A-grade suppliers
79.7%
 
2023
80.0%
 
2024
Grade Number of Suppliers Subsequent Management Measures
A (Above 80) 92 Priority procurement
B (70~79) 19 Maintain normal
C (60~69) 4 Reduced procurement. Procurement unit notifies suppliers of evaluation results; suppliers make improvements based on evaluation results. If alternative suppliers are available, procurement unit should reduce purchasing as appropriate.
D (Below 59) 0 Suppliers should provide written improvement strategies with a deadline for improvement. If requirements still cannot be met after review according to “Supplier Audit Improvement Notice”, qualified supplier status may be canceled.

General affairs supplier meeting: Sharing experiences and fostering growth with partners

To promote the exchange of sustainability knowledge and practices across our supply chain, WT held a General Affairs Supplier Meeting in Taiwan in 2024. The event focused on three core themes: occupational health and safety, greenhouse gas (GHG) emissions, and green procurement, aiming to promote sustainability values among general affairs suppliers. Key topics included the importance of occupational accident prevention, reinforced through real-world incident case studies and an overview of relevant occupational safety regulations; an introduction to Taiwan’s GHG-related regulations and practical procedures for GHG inventory; WT’s energy-saving and carbon reduction strategies, along with short-, medium-, and long-term targets; and the standards used to assess suppliers’ sustainability performance during the procurement process. Through this educational initiative, WT and our suppliers jointly enhanced the quality of green procurement and enabled suppliers to better align their practices with future sustainability goals. The supplier meeting will continue to be held annually, with plans to extend the initiative to other overseas sites, maximizing the impact of sustainable development across the supply chain through top-down collaboration.


Continuous monitoring of Environmental and Social management by major suppliers

WT is committed to promoting sustainable development in the supply chain. We encourage our major suppliers to provide high-quality products and services while complying with national regulations and policies. They must ensure that their products and manufacturing processes adhere to environmental and social responsibility standards. Suppliers are required to prohibit the use of hazardous substances (such as those restricted by the EU RoHS directive), ensure that raw materials do not contain conflict minerals, and sign a Conflict-Free Minerals Declaration, In 2024, there were no incidents of non-compliance with health and safety regulations related to products and services.

Additionally, WT encourages suppliers to adopt ISO certifications to enhance quality management. Suppliers are also urged to implement occupational safety measures, labor rights protections, and environmental protection initiatives, working together to establish a responsible and sustainable supply chain.

WT considers suppliers as long-term partners and maintains close communication with them. Through continuous engagement, we promote the implementation of environmental sustainability, social responsibility, and ethical standards. We also emphasize compliance and corporate responsibility in operations, ensuring that suppliers commit to ethical business practices, human rights principles, and corporate ethics.

Self-regulation of major Supplier Codes of Conduct

The major supplier have established comprehensive business conduct guidelines to ensure compliance with relevant regulations and international standards.

Supplier Environmental Management and International Standard Certifications

WT places strong emphasis on supply chain responsibility. The company has identified and selected 36 key suppliers, which collectively account for over 80% of total revenue. Each year, WT conducts assessments on the status of these vendors’ adherence to the RBA Code of Conduct, chemical substance commitments, and conflict minerals policies, and updates the list of key suppliers at the beginning of each year

The key suppliers have adopted ISO certifications to ensure their operations meet international standards. By implementing strict management systems, they enhance operational efficiency and minimize environmental impact.

As of the end of 2024, key suppliers have achieved the following certifications:

Certification Type Key Suppliers Certified Suppliers Percentage (%)
ISO 14001 Environmental Management System 36 33 92
ISO 9001 Quality Management System 36 35 97

• ISO 14001 Environmental Management System: In the 36 key suppliers, 33 have obtained certification, accounting for 92%
• ISO 9001 Quality Management System: In the 36 key suppliers, 35 have obtained certification, accounting for 97%


Employee Rights and Labor Protection

The supplier must comply with local laws to protect employee rights, ensuring:

• Respect for employees’ rights to unionize, engage in collective bargaining, and enjoy freedom of association.
• Establishment of communication channels to safeguard labor rights and prevent forced labor, child labor, or discrimination.


Responsible Business Alliance (RBA) Code of Conduct

WT supports and adheres to the Responsible Business Alliance (RBA) Code of Conduct, striving to improve labor rights, health and safety, and environmental standards to ensure compliance with international and ethical norms.
As of the end of 2024, WT continuously monitors 36 key suppliers, of which 22 are official RBA members, representing 61% and have established comprehensive RBA guidelines.

Indicator Key Suppliers Established RBA Guidelines Percentage (%)
RBA Membership 36 22 61

Additionally, WT actively tracks whether suppliers undergo RBA audits to promote ongoing improvements in labor conditions throughout the supply chain.


Compliance of Agency Products with Global Substance Regulations

1976
TSCA
United States Toxic Substances Control Act

1986
Prop 65
California Proposition 65

2003
EU RoHS
European Union Restriction of Hazardous Substances Directive

2004
EU POPs
European Union Persistent Organic Pollutants Regulation

2007
EU REACH
European Union Registration, Evaluation, Authorisation and Restriction of Chemicals

2016
China RoHS
Administrative Measures for the Restriction of the Use of Hazardous Substances in Electrical and Electronic Product

2023
PFAS
Per- and Polyfluoroalkyl Substances

Chemical Management and Product Compliance

With increasing global emphasis on environmental protection, WT continues to monitor regulatory developments and ensures that suppliers’ agency products fully comply with relevant global substance regulations. We actively track and update compliance measures to meet customer requirements.

When customers request material substance lists for products, WT assists in obtaining relevant documentation from suppliers, such as non-use declarations, product composition reports, and third-party hazardous substance testing reports.

In 2024, all sold products complied with customer chemical management requirements. All of 36 key suppliers publicly declared full compliance with relevant chemical management regulations.

As of the end of 2024, compliance rates key suppliers are as follows:

Regulation Key suppliers Publicly Disclosed Compliance Disclosure Rate (%) Non-Disclosed (Available on Request) Non-Disclosure Rate (%)
EU RoHS 36 24 66.7 12 33.3
REACH 36 23 63.9 13 36.1

• EU RoHS (Restriction of Hazardous Substances Directive): In the 36 key suppliers, 24 have publicly disclosed compliance (66.7%), while 12 have not disclosed, accounting for 33.3%, all key suppliers have provided formal declarations confirming that the materials used in their products comply with major international environmental regulations.
• REACH (Registration, Evaluation, Authorization, and Restriction of Chemicals): In the 36 key suppliers, 23 have publicly disclosed compliance (63.9%), while 13 have not disclosed, accounting for 36.1%, all key suppliers have provided formal declarations confirming that the materials used in their products comply with major international environmental regulations.

Chemical Safety Management Process

01.
Hazardous Substance Management

• EU RoHS
• EU REACH
• EU POPs
• TSCA
• Prop 65
• China RoHS
• PFAS

02.
Collect Supplier Information

• Compliance Documents
Third-Party Test Report
Supplier Self- Declaration

03.
Verify Supplier Documents

• Comply with the Latest Regulations

04.
Full Material Disclosure (FMD)

• Chemical Composition

05.
Continuous Monitoring of Controlled Substances

Conduct Compliance Investigation Annually
Monitor Regulatory Updates and Requirements

Furthermore, WT is actively implementing system-based management. In the future, when creating new product materials, relevant departments will be notified to obtain the necessary material substance lists such as product composition reports and third-party hazardous substance testing reports. This will ensure compliance and improve the efficiency of providing relevant material disclosures.

Inventory for the Management of Regulations Concerning Substances
· European Union Restriction of Hazardous Substances Directive (EU RoHS)
· European Union Registration, Evaluation, Authorisation and Restriction of Chemicals (EU REACH)
· European Union Persistent Organic Pollutants Regulation (EU POPs)
· United States Toxic Substances Control Act (TSCA)
· California Proposition 65 (Prop 65)
· Administrative Measures for the Restriction of the Use of Hazardous Substances in Electrical and Electronic Products (China RoHS)

PFASPFAS (Per- and Polyfluoroalkyl Substances) Management

In 2023, the EU introduced a proposal to ban PFAS, a broad class of synthetic chemicals known for their persistence, long-range transport potential, and bioaccumulation risks. These substances pose significant environmental and health hazards, including water pollution.

In industries such as semiconductors, no viable alternatives currently exist, and immediate production cessation is not feasible. Therefore, a transition period of 13-15 years will be implemented upon enforcement of the regulations.

WT continues to investigate PFAS usage in supplier products and discloses this information to customers, aiming to mitigate environmental and health risks.

Carbon Footprint and Net-Zero Emission Goals

In response to global carbon reduction initiatives, WT is dedicated to carbon footprint assessments, aiming to reduce, capture, and reuse greenhouse gas emissions. The long-term goal is to achieve Net Zero Emissions by 2050, transforming carbon reduction efforts into competitive advantages and steadily implementing sustainability initiatives.


The customer requests products with conflict minerals traceability, 100% sourced from qualified smelters

Conflict Minerals Sourcing and Traceability Mechanisms

Referencing international concerns about conflict minerals originating from regions with human rights issues, and in support of universal humanitarian values in supply chain practices, WT published its Conflict Minerals Policy on the company website in 2023. The policy mandates that all major suppliers comply with the U.S. Securities and Exchange Commission’s (SEC) conflict minerals regulation – Section 1502 of the Dodd-Frank Wall Street Reform and Consumer Protection Act (DFCMA). Vendors are required to fully disclose the sources of conflict minerals used in their manufacturing processes, including gold (Au), tantalum (Ta), tin (Sn), and tungsten (W) – collectively referred to as 3TG – and indicate whether these materials originate from high-risk mines in the Democratic Republic of the Congo (DRC) and neighboring countries.

To ensure conflict-free sourcing, WT regularly reviews major suppliers’ conflict minerals policies and traces the origins of materials in distributed products. The company actively monitors smelter assessment updates published by the Responsible Minerals Initiative (RMI), and requests vendors to submit the latest Conflict Minerals Reporting Template (CMRT), Extended Minerals Reporting Template (EMRT), or Additional Minerals Reporting Template (AMRT), in alignment with customer requirements.

Conflict Minerals Management Process

01.
Conflict Minerals Regulation Management

RMI (Responsible Minerals Initiative)
DFCM (Dodd-Frank Conflict Minerals Act, Dodd-Frank)
OECD(OECD Due Diligence Guidance for Responsible Supply Chains of Minerals)
Conflict Minerals Reporting Template

02.
Collect Supplier Information

CMRT
EMRT

03.
Verify Supplier Documents

Comply with Conflict Minerals Regulations

04.
Regular Review of Public Information

List of Qualified Smelters

As of the end of 2024, the conflict minerals disclosure status of WT’s 36 key suppliers is as follows:

Indicator Key Suppliers Publicly Disclosed Conflict-Free Compliance Compliance Rate (%) Non-Disclosed (Available on Request) Non-Disclosure Rate (%)
Conflict-Free Sourcing Compliance 36 29 80.6 7 19.4

• 29 suppliers (80.6%) publicly disclosed a commitment to the non-use of conflict minerals.
• 7 suppliers (19.4%) did not publicly disclose such information; however, all of them provided formal declarations demonstrating compliance with the RBA Code of Conduct and related standards.


After WT Tracks And Discloses Relevant Information

ROHS
100%
 
66.7% Public Disclosure (24/36)

33.3% Non-Public Disclosure (12/36)

REACH
100%
 
63.9% Public Disclosure (23/36)

36.1% Non-Public Disclosure (13/36)

CONFLICT MINERAL POLICY
100%
 
80.6% Public Disclosure (29/36)

19.4% Non-Public Disclosure (7/36)

Public Disclosure: Disclosed on the supplier’s official website, accessible for viewing and downloading at any time. | Non-Public Disclosure: Request Documents from Supplier.

Activate Green Innovation

As a leading semiconductor distributor, WT is committed to providing cutting-edge products and exceptional solutions to tens of thousands of customers and end-users worldwide, overcoming various challenges. However, facing the increasingly severe climate change, WT is committed to taking responsibility, actively responding to climate risks, and seizing the opportunities that arise. We will continue to deepen our expertise in green design, develop energy-saving products and solutions, optimize energy efficiency, and reduce the carbon footprint of our customers and end-users. At the same time, we will work with supply chain partners to respond to various advocacy initiatives and jointly implement the four major green design goals of energy conservation, waste reduction, resilience, and efficiency.


WT
Platform Leverage  Solution Provider Technical Service
⎯ Addressing climate risks and opportunities

• Extreme weather event
• Climate regulatory and policy
• Market demand change
• Technological innovation and iteration
• Supply chain disruption

⎯ Enhancing green design

• Energy conservation
• Waste reduction
• Resilience
• Efficiency

⎯ Strengthening social resilience

• Strengthen supply chain resilience
• Design resilience applications
• Society safer and resilience

⎯ Participating in advocacy initiatives

• Green design advocacy initiative
• Collaborates with suppliers and customer
• Industry-academia collaborations

▲ WT is committed to advancing clean technology and green design, guided by three core values and four action strategies


Addressing climate risks and opportunities

WT has identified five main climate risk factors:

(1) Extreme weather event risk: Property damage or transportation disruptions caused by natural disasters such as typhoons, hurricanes, floods, droughts, high temperatures, and heavy snow.

(2) Climate regulatory and policy change risk: Laws or standards introduced by countries or regions to reduce carbon emissions and waste, which may affect production costs and require products to meet stricter standards after changes.

(3) Market demand change risk: Increased demand for energy-efficient and high-performance products due to rising environmental awareness, leading to the inability to continue selling or using existing products.

(4) Technological innovation and iteration risk: Economic and equipment investment in developing new technologies and components, requiring significant professional manpower and resources for research and development.

(5) Supply chain disruption risk: Production or supply chain disruptions caused by climate change, such as resource scarcity affecting production or transportation, electricity, or water resources, leading to disruptions throughout the supply chain.

Climate Risk Risk Description Climate Opportunity
Extreme Weather Events Frequent typhoons, floods, high temperatures, heavy snow, etc. Emerging markets for environmental monitoring and climate early warning systems, and active participation in green initiatives.
Changes in Climate Regulations and Policies Regulations or standards introduced by various countries or regions to reduce carbon emissions and waste. Promoting environmentally friendly electronic components and developing green product markets
Changes in Market Demand Increased demand for energy-efficient and high-performance products due to rising environmental awareness; decreased demand for traditional energy or high-energy consumption applications. WT is increasing and accelerating R&D and investment in energy efficiency issues for high-energy consumption industries, such as power supplies, motors, and artificial intelligence.
Technological Innovation and Iteration Risk Continuous and substantial R&D investment required due to the ongoing development of new technologies and components driven by climate change. In green technology innovation, WT’ long-term development and promotion of green energy and energy storage technologies have led to industry chain adoption.
Supply Chain Disruption Risk of production or supply chain disruptions (e.g., production, design, assembly, transportation) caused by climate events. Close cooperation with customers and suppliers to enhance supply chain resilience.

In addition to identifying the aforementioned risks, WT actively invests resources to address climate opportunities. In green technology innovation, WT has facilitated the adoption and implementation of technologies such as green energy and energy storage within the industry chain through long-term development and promotion. Regarding the issue of improving energy efficiency, WT continues to accelerate research and development and increase investment in research related to high-energy-consuming industries such as power supplies, motors, and artificial intelligence. In emerging markets such as environmental monitoring and climate early warning, or in response to supply chain challenges posed by extreme climates, we also maintain close collaboration with customers and suppliers to enhance supply chain resilience. We continuously and actively participate in green initiatives, promote environmentally friendly electronic components, and develop the green product market, enabling WT to make significant contributions.


Enhancing green design

Green design is not only a key to addressing climate change, but also a significant opportunity for industrial development. As a leading semiconductor distributor and a key player in the electronics industry, WT actively invests in technological innovation, market expansion, and application deepening of green design, while integrating clean technology and green thinking into every design. From the selection of green materials for semiconductor components and supply chain management to the sustainable architecture, component durability, and energy-efficient applications of product design, we are committed to extending product lifecycles. With the responsibility of a semiconductor distributor, WT contributes to the electronics industry’s response to climate change through green innovation.

Green Design Target WT offers green design solutions
Energy conservation Technology solutions across multiple sectors such as power measurement, energy-efficient motors, AI PCs, home and industrial control, and communication systems to realize our carbon reduction and decarbonization objectives


· High-Precision eMeter
· MCU based ultra low power HMI
· AI PC low-power power management
· BLDC in energy-saving home appliances
· 5G base station RF front-end

Waste reduction Reducing carbon footprint or fossil fuel dependence, extending product lifecycles, promoting the circular economy, and recycling waste, including batteries


· Matter: Smart Home wireless communication
· Renewable Energy Solutions
· Electric Vehicle AC cord set solution
· Battery: Aging, Measurement, and Estimation Technologies research
· Module and common footprint design for multiple applications

Resilience Resilience means maintaining social and economic stability in the face of extreme weather events and reliable power supply


· Modular energy storage system(ESS)
· Motor Controller with ML-Based Fault Prediction
· Battery Backup Unit (BBU) Solutions
· Bi-directional Energy Supply and Recycle system

Efficiency High-performance solutions for high-energy-consuming applications


· AI Servers (CPU/GPU/TPU/ASIC) core power solution
· Wide Bandgap GaN in High-Power, High-Efficiency Power Supply
· High-Power Density GaN RF Modules
· On-Board Charger (OBC) Modules
· Inverter Solution

WT continues to collaborate with suppliers, prioritizing products with green design concepts (such as those assessed to reduce resource usage or chemical substance content by 10% or more).

We focus on green applications and clean technology (such as clean transportation in electric vehicles or autonomous driving systems), and continuously improve energy efficiency in data centers, communication systems, public facilities, and other areas. In addition to continuously introducing more energy-efficient solutions, we also propose designs that benefit the environment and human health and safety in diverse fields such as industrial automation, infrastructure, and medical and healthcare.

Serving tens of thousands of customers globally, WT analyzes different regions, markets, and applications, not only strengthening economic influence, but also collaborating closely with suppliers on green design and clean technology-related applications, promoting industry sustainability and green innovation.


Strengthening social resilience

WT provides high-quality products from leading suppliers to serve tens of thousands of manufacturers worldwide, and continuously builds strategic partnerships with leading vendors and customers. We not only strengthen supply chain services and improve inventory management to address supply chain disruptions caused by extreme weather, but also actively increase R&D investment in green design. In these green designs, we act as a bridge for multi-party collaboration between industry, academia, and research, and propose excellent solutions. This not only enhances the technological development of our customers but also cultivates talent, improves industrial innovation capabilities, and accelerates green transformation. These actions not only strengthen the resilience of the supply chain and industry but also make society safer and more progressive.

To design resilience applications, extreme weather may cause disruptions in electricity, communication, transportation, and other areas. WT, in its research, development, and promotion, has emphasized the importance of resilience in various applications. For example, we have invested in the research and development of technologies such as renewable energy and grid-tied systems in power supply systems, battery safety and power management in energy storage systems, and the design of solutions for early warning, protection, and backup in response to power outages or quality degradation in different application areas.

In strengthening system resilience, we emphasize redundant design and flexible architecture, enhance the ability to respond to faults or risks, and continuously improve scalability. WT uses a modular architecture to make design redundancy and maintenance simpler and easier, and can shorten the replacement or response time in the event of a fault or risk. Modular design also has many advantages when functional upgrades are required, which not only ensures that the system is not interrupted due to upgrades, but also disperses development resources, reduces vulnerability risks, and eliminates safety hazards, further strengthening application resilience.

Energy Storage System (ESS)


Composed of batteries, battery management systems (BMS), energy management systems (EMS), power conversion systems (PCS), and other auxiliary facilities. Batteries are the core of the entire system, currently dominated by lithium batteries (such as LFP or NMC). The BMS is responsible for monitoring the voltage, temperature, and current of each battery cell, and balancing charging and discharging in real time to maintain the battery within a safe range. The EMS is a higher-level coordination management layer that can integrate load data, renewable energy generation, and grid conditions to dynamically allocate battery charging and discharging strategies. The PCS performs energy conversion between direct current and alternating current, such as inverters that convert the direct current of the battery into alternating current that can be used by buildings or the grid.

WT integrates products provided by multiple suppliers to propose modular solutions for large-scale energy storage systems for commercial and industrial use: the system uses several battery modules installed in racks or containers, and is assisted by fire protection / detection/ suppression/ control mechanisms, and then connected in series or parallel to form a larger capacity. Functional safety-rated microcontrollers are used to meet the needs of safety and microgrid integration. System on Chip (SoC) is used as the core of the system to improve the communication and processing performance of the energy management system.

In the promotion of modularization, WT modularizes battery packs and battery management systems (BMS), which can be flexibly stacked and configured according to applications. In addition, modular solutions are available for power conversion equipment, microgrid architecture, power meters, fire safety, and other protection and monitoring functions.


Participating in advocacy initiatives

WT collaborates closely with suppliers and customers, actively participating in green product and design initiatives, and prioritizing them in new product and application development.

In the semiconductor and electronic design industry chain, WT provided three core values:

Platform Integration: Serving as a bridge between suppliers and customers, facilitating collaboration

Technical Services: Providing technical services and promoting low-power, high-performance products and applications

Solution provider: Investing resources in researching clean technology-related products and applications, and providing solutions

In addition, WT actively participates in sustainable development seminars, engaging various industries (including transportation, rawmaterials, academic research, and petrochemicals). These conferences involve sharing the electronics industry’s net-zero goals and achievements, and exploring topics such as green energy, climate risks and opportunities, and carbon capture and storage. Through these actions, WT is committed to promoting the sustainable development of the industry.

Accelerating industry’s net-zero emissions through industry-academia collaboration

WT is dedicated to being a strategic partner to suppliers and customers. We have continuously invested resources to provide diverse technical services, assisting customers in quickly developing solutions and becoming a technical platform that delivers high-quality products and optimal solutions across various domains.

In pursuit of net-zero carbon emissions, industry-academia collaboration is crucial. WT actively promotes such collaboration through the following methods:

Information Sharing: Sharing real-world data from production, operations, and field applications, along with relevant data, to provide academic institutions with references for green design related to net-zero carbon emissions.

Technical Cooperation: Leveraging the academic community’s expertise and research resources in areas such as carbon capture, renewable energy, and carbon reduction technologies to accelerate technological innovation and research and development.

Talent Development and Resource Integration: Collaborating with suppliers and educational institutions to propose joint research projects, establish industry-academia programs, and participate in results presentations and exchanges, integrating the resources and strengths of academia and industry to accelerate the research, development, and application of carbon reduction technologies, and cultivate professional talent.

Through these efforts, WT not only promotes the sustainable development of the industry but also accelerates the realization of critical net-zero goals.

In 2024, facilitated an exchange visit to WT for international students from National Chengchi University, supporting international talent career development and promoting cross-border industry-academia collaboration.

WT supports the National Taipei University of Technology’s commitment to practical engineering education, translating theoretical knowledge into practical operations and vehicle validation techniques, and deepening students’ understanding of technology and professional skills. In 2024, WT sponsored the National Taipei University of Technology Formula Racing Team to participate in the 2024 Student Formula Competition.

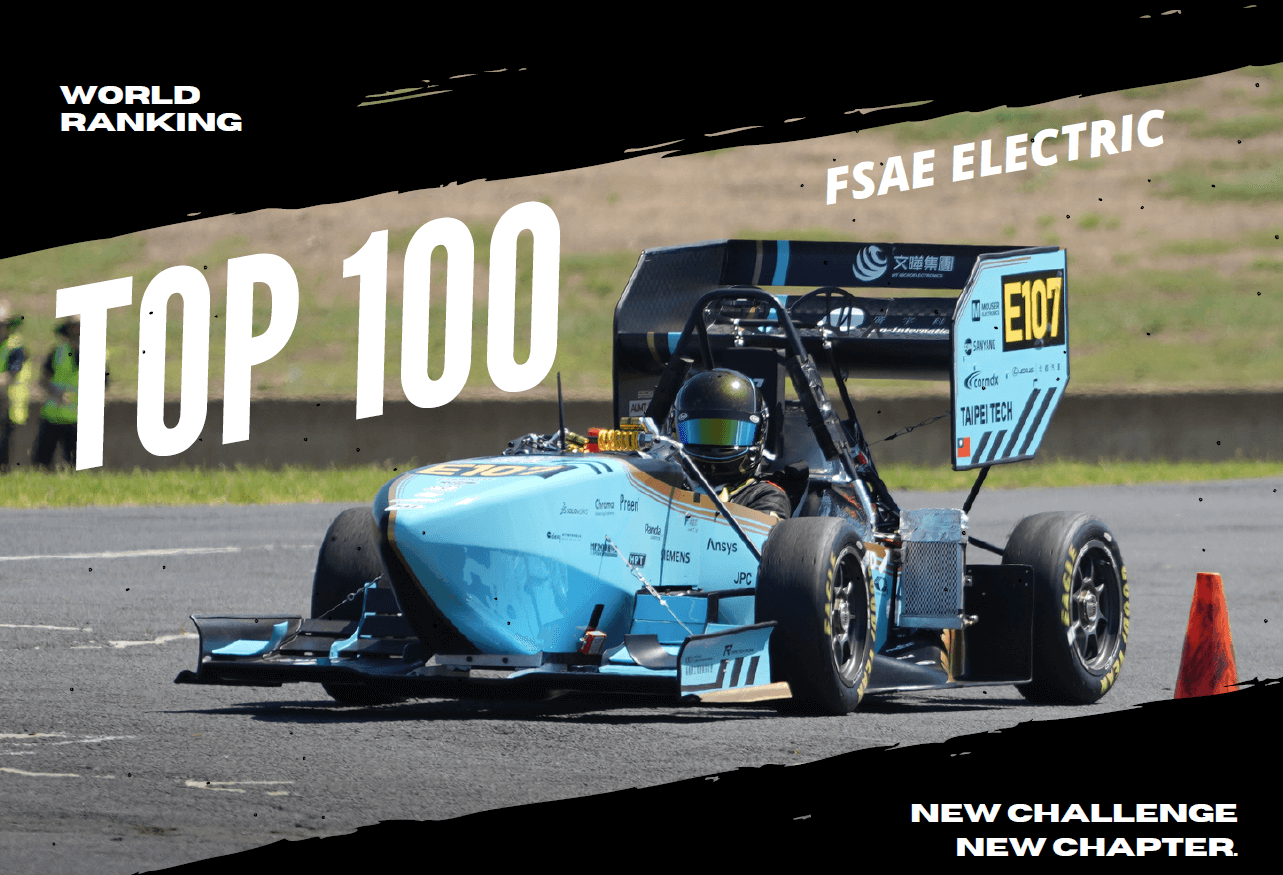
The Taiwan Student Formula League provides a platform for students to design and manufacture “Student Formula Cars” independently, and encourages exchange and learning among schools during the competition. Student Formula (FSAE) is not just a racing competition, but a comprehensive engineering and technology contest. The competition combines various fields: mechanics, materials, electricity, control, analysis, and business content such as marketing and business reports, all to train students to manage and build a small commercial-scale engineering team. The competition content is mainly divided into three parts: “design document review”, “on-site vehicle inspection”, and “track dynamic competition”. In 2024, the National Taipei University of Technology team achieved third place, and was the only team to stand on the podium for three consecutive years. In December 2024, the National Taipei University of Technology racing team also went to Melbourne, Australia to participate in the Formula SAE Australasia competition and successfully completed all inspections. To ensure smooth passage through static inspections, the team focused on preparing complete documents and familiarizing themselves with the rules and vehicle inspection procedures. As a result, they won the Best Vehicle Inspection Award from the competition judges and achieved an impressive 13th place overall. The National Taipei University of Technology Formula Racing Team’s world ranking has also moved up to 99th place following the success of the Australian competition.

Improve the past, change the future

As a leading semiconductor distributor, WT collaborates with hundreds of suppliers to serve tens of thousands of customers worldwide, jointly driving product and application innovation, improving lives, and shaping the multi-faceted future of the semiconductor industry in areas such as environment, society, education, economy, technology, and safety.

Review and Collaboration:

-Continuously collaborate with suppliers and customers to expand energy consumption and carbon footprint inventories
-Ensure suppliers provide green products that comply with regulations
-Collaborate with customers to reduce waste and adopt energy-saving technologies

Short-Term Plan:

-Actively distribute and promote green products
-Invest in research and development of forward-looking sustainable green solutions to drive industry green transformation

Mid-Term Plan:

-Continuously participate in green initiatives, implementing green design concepts in various applications
-Pursue environmentally friendly designs, providing low-power, high-performance chips and solutions

Long-Term Plan:

-Continuously disclose sustainable supply chain audit results and respond to carbon footprint inventory requests
-Collaborate with customers on inventory management to extend product lifecycles
-Collaborate with suppliers to strengthen global logistics and reuse plans, achieving waste reduction and a resilient future


High energy use, high efficiency needed

Artificial intelligence (AI) has experienced continuous development in recent years. Whether it’s machine learning, deep learning, or generative AI, coupled with the increasing accessibility and easy to use. AI’s integration and fusion across various industries has been promoted. For instance, AI is utilized to assist medical procedures and new drug development in health and preventive medicine. In financial management and economic activities, AI enhances customer experience and strengthens risk management. In manufacturing and retail, AI automates production and improves quality management through intelligent solutions. In personal transportation and logistics management, AI assistance makes transportation safer and more efficient.

All these conveniences and changes brought about by AI originate from semiconductor components. However, for AI to deliver accurate and effective functions, it requires training and inference capabilities. Comparing the power consumption differences between AI servers and traditional servers, traditional servers typically consume between 300 to 1500 watts, while the addition of AI accelerator GPUs or TPUs significantly increases power consumption to over 2000 watts.

WT recognizes the highly promising and forward-looking of AI. However, technological development must incorporate environmental sustainability as the foundation of all designs. Therefore, we have collaborated with suppliers and customers to propose three solutions to address the high energy consumption of AI servers:

1.We have designed a 3000-watt power supply for servers based on advanced control technologies and high-efficiency electronic components. 2.In collaboration with computing units such as CPUs/GPUs/TPUs/ASICs, we provide core power solutions with high energy efficiency to meet their computational demands. 3.In partnership with thermal management and cooling technology companies, we provide microcontrollers with communication and management functions to efficiently reduce system power consumption by dissipating heat generated by high-performance hardware.

 
Continuous increase in R&D Investment and clean technology (low-carbon products) revenue contribution

In 2024, research and development investment reached NT$851 million. WT commits to continuously investing in clean technology R&D resources, aiming to increase R&D expenditure to NT$1 billion by 2030. WT focuses on the development and advancement of areas such as green energy, energy storage, and efficiency. Clean technology-related (low-carbon products) revenue reached 14.07% of total revenue,increased 2.64 percentage point compared with previous year. WT is targeting to achieve the goal of 20% clean technology-related revenue contribution by 2030.

An increase in Research and development (R&D) spending in 2024 for the fifth consecutive year (in NTD million)

 
R&D spending
 
R&D spending to revenue ratio


386
 
609
 
655
 
755
 
851
 
0.11%
 
0.14%
 
0.11%
 
0.13%
 
0.09%
2020
2021
2022
2023
2024

Investing in solar plant developer and serving as a representative director

WT invested NTD 12.5 million in Daypower Co., Ltd. in April 2023. WT owns 10% shares of Daypower and serves as a representative director. WT participated in cash capital increase of Daypower and invested NTD 12.5 million in August 2024. WT maintains 10% shares of Daypower and accumulated investment amount reaches NTD 25 million. Daypower is a solar plant developer and completed 3.24 MW installation in 2024. Self-held solar plant reached 3.00 MW installation accumulatively in 2024, which generated 3.75 million kwh in 2024, equaling to 1,853 ton CO2 reduction.


Promoting three major waste reduction policies: waste sorting, recycling, and reusing packaging materials

WT is committed to source reduction and recycling, and selects qualified suppliers to properly dispose the waste. The waste generated during WT’s operation is mainly made up of operational waste, daily-life waste discarded by employees, and redundant sample ICs in the offices, and cartons, paper boards, fillers and waste left from carton sealing at the logistics centers.

WT has been proactively making sustainability efforts. It plans to optimize and transform internal meeting setups to meet the prerequisite of being eco-friendly and beneficial for sustainability. Meetings will be plastic-free and disposablefree. In principle, no disposable tableware or plastic bags will be used. Meeting venues will be decorated with artificial flowers as they are more reusable, and bottled water will be replaced with glasses towards the ultimate goal of plastic-free meetings. In addition, the offices will buy less and less single-use consumables for daily operations and use durable recyclable products whenever possible. Waste reduction and carbon reduction awareness campaign for employees will be intensified, and waste sorting and recycling measures implemented to achieve the goal of waste reduction.

As of the end of 2023, no hazardous waste is generated. Among the non-hazardous waste, the recyclables are collected and reused, while the non-recyclables are incinerated with energy recovery. No waste is land-filled. The total amount of waste was 132.56 tons, down 17.90 tons or 11.90% relative to 2022. Daily-life waste has decreased over the years, mainly as a result of effective waste reduction and sorting practices.